
Portfolio | Bluesky | OtterTune | Triple Point | Topix

The Client: DBtune
My Title: Contract Designer (2025)
About the company: DBtune is a Malmö-based company founded in 2020 by a team of engineers and researchers, aiming to revolutionize how businesses manage their databases. By leveraging artificial intelligence and machine learning, DBtune helps organizations optimize database performance, enhance user experiences, and reduce cloud costs.
My Role: Contractor hired to redesign and improve upon existing dashboard and guardrail database configuration profiles. I had experience at a previous company with a similar product.
Project Overview
DBtune helps database engineers and developers automatically optimize PostgreSQL and MySQL configurations. Its primary features include:
Automated tuning using machine learning
Side-by-side configuration comparison
Performance metrics tracking (e.g., latency, throughput)
Cloud-native deployment on AWS and other platforms
It's designed to improve database performance with minimal manual effort.
My role was to provide iterative design proposals to improve the user flow from the dashboard to the configuration overview and to make configuration comparisons and layouts easier to manage and understand.
Why a Redesign
To enhance the existing product from one designed by its engineering team, with minimal information for the user, to one providing a richer and more actionable user experience utilizing existing features and data as well as the ability for the user to more easily dive deeper down into the product.
Project Goals
The designs shown here are the first step in a longer process in providing the user instant information, with a mix of visuals and easy to understand text, on the health of not just individual databases, but entire fleets as well. This is similar to the work I did at OtterTune and their desire was to accomplish something similar.
Redesign Snapshots
Research Process
As a hired contractor, my research was limited solely to internal stakeholders at DBtune. I did not have contact or direct feedback from existing customers. My research was primarily meeting with the company’s founder, its head of engineering and product management as well as competitor analysis.
Research included ramping up on understanding the product overall, and how that pertained to product, company and customer goals. Original concepts and ideas were broken down via FigJam from Zoom meetings and additional feedback and discussion in Figma’s commenting system.
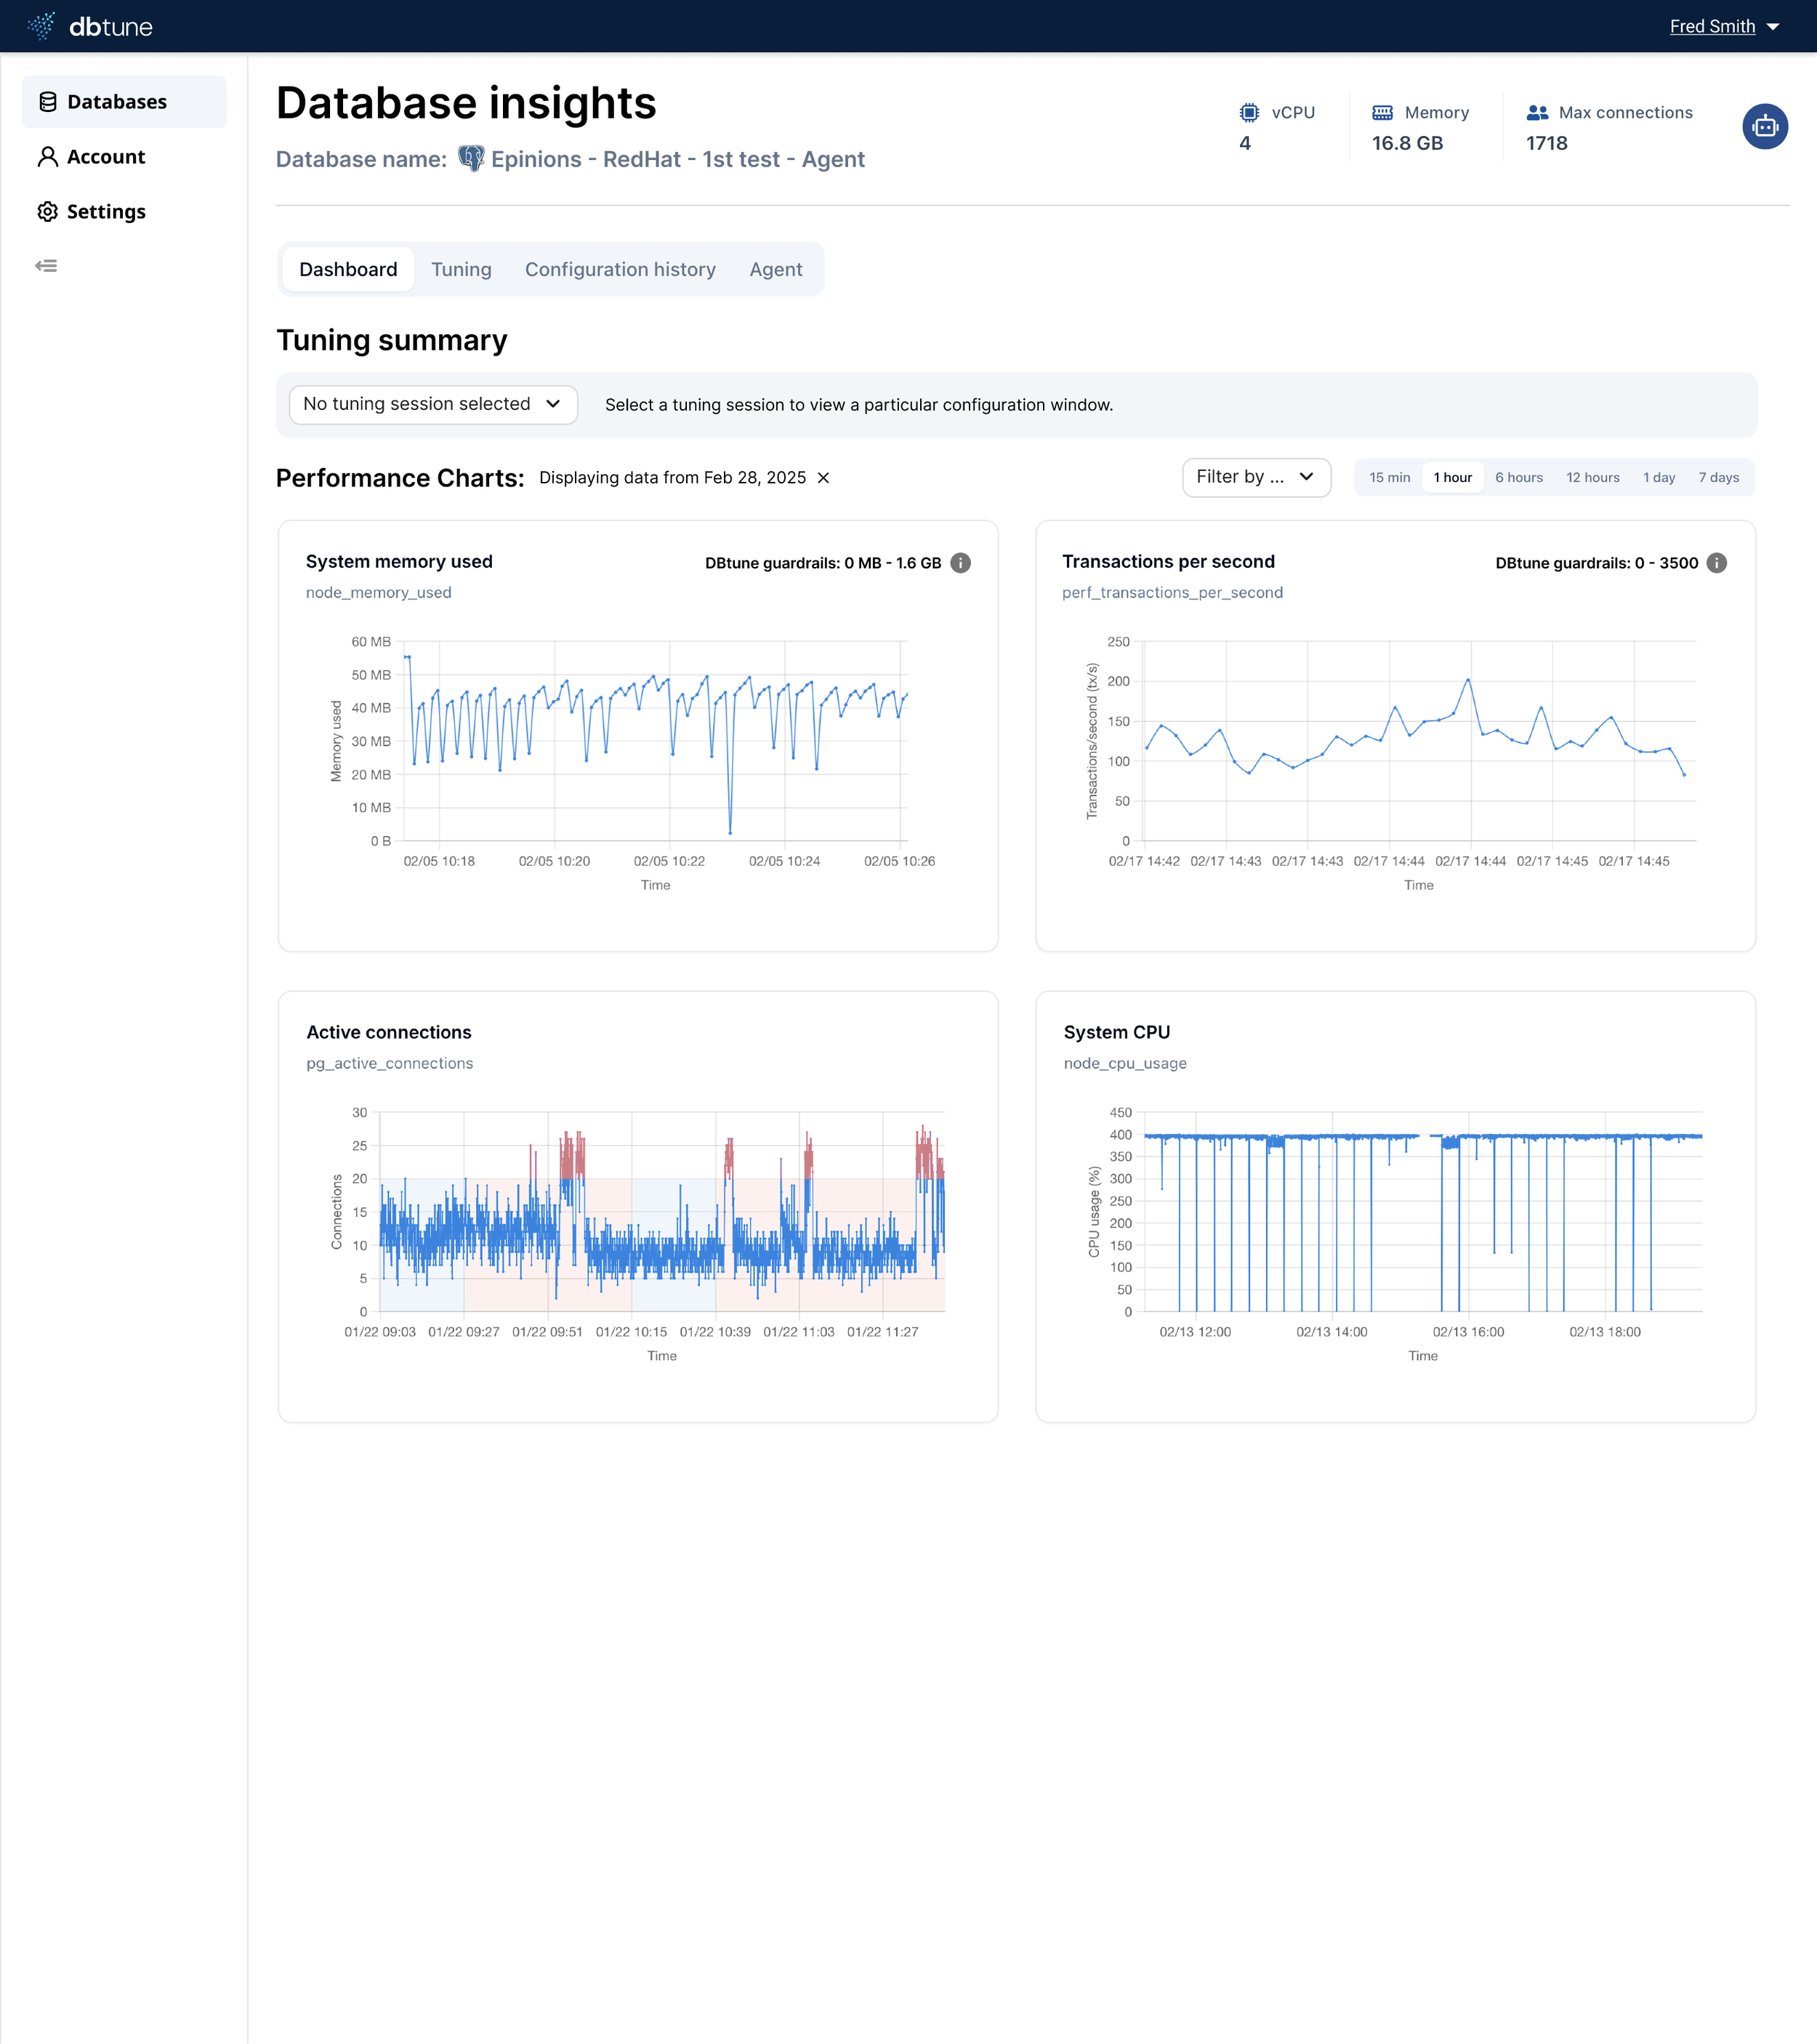
Current Dashboard
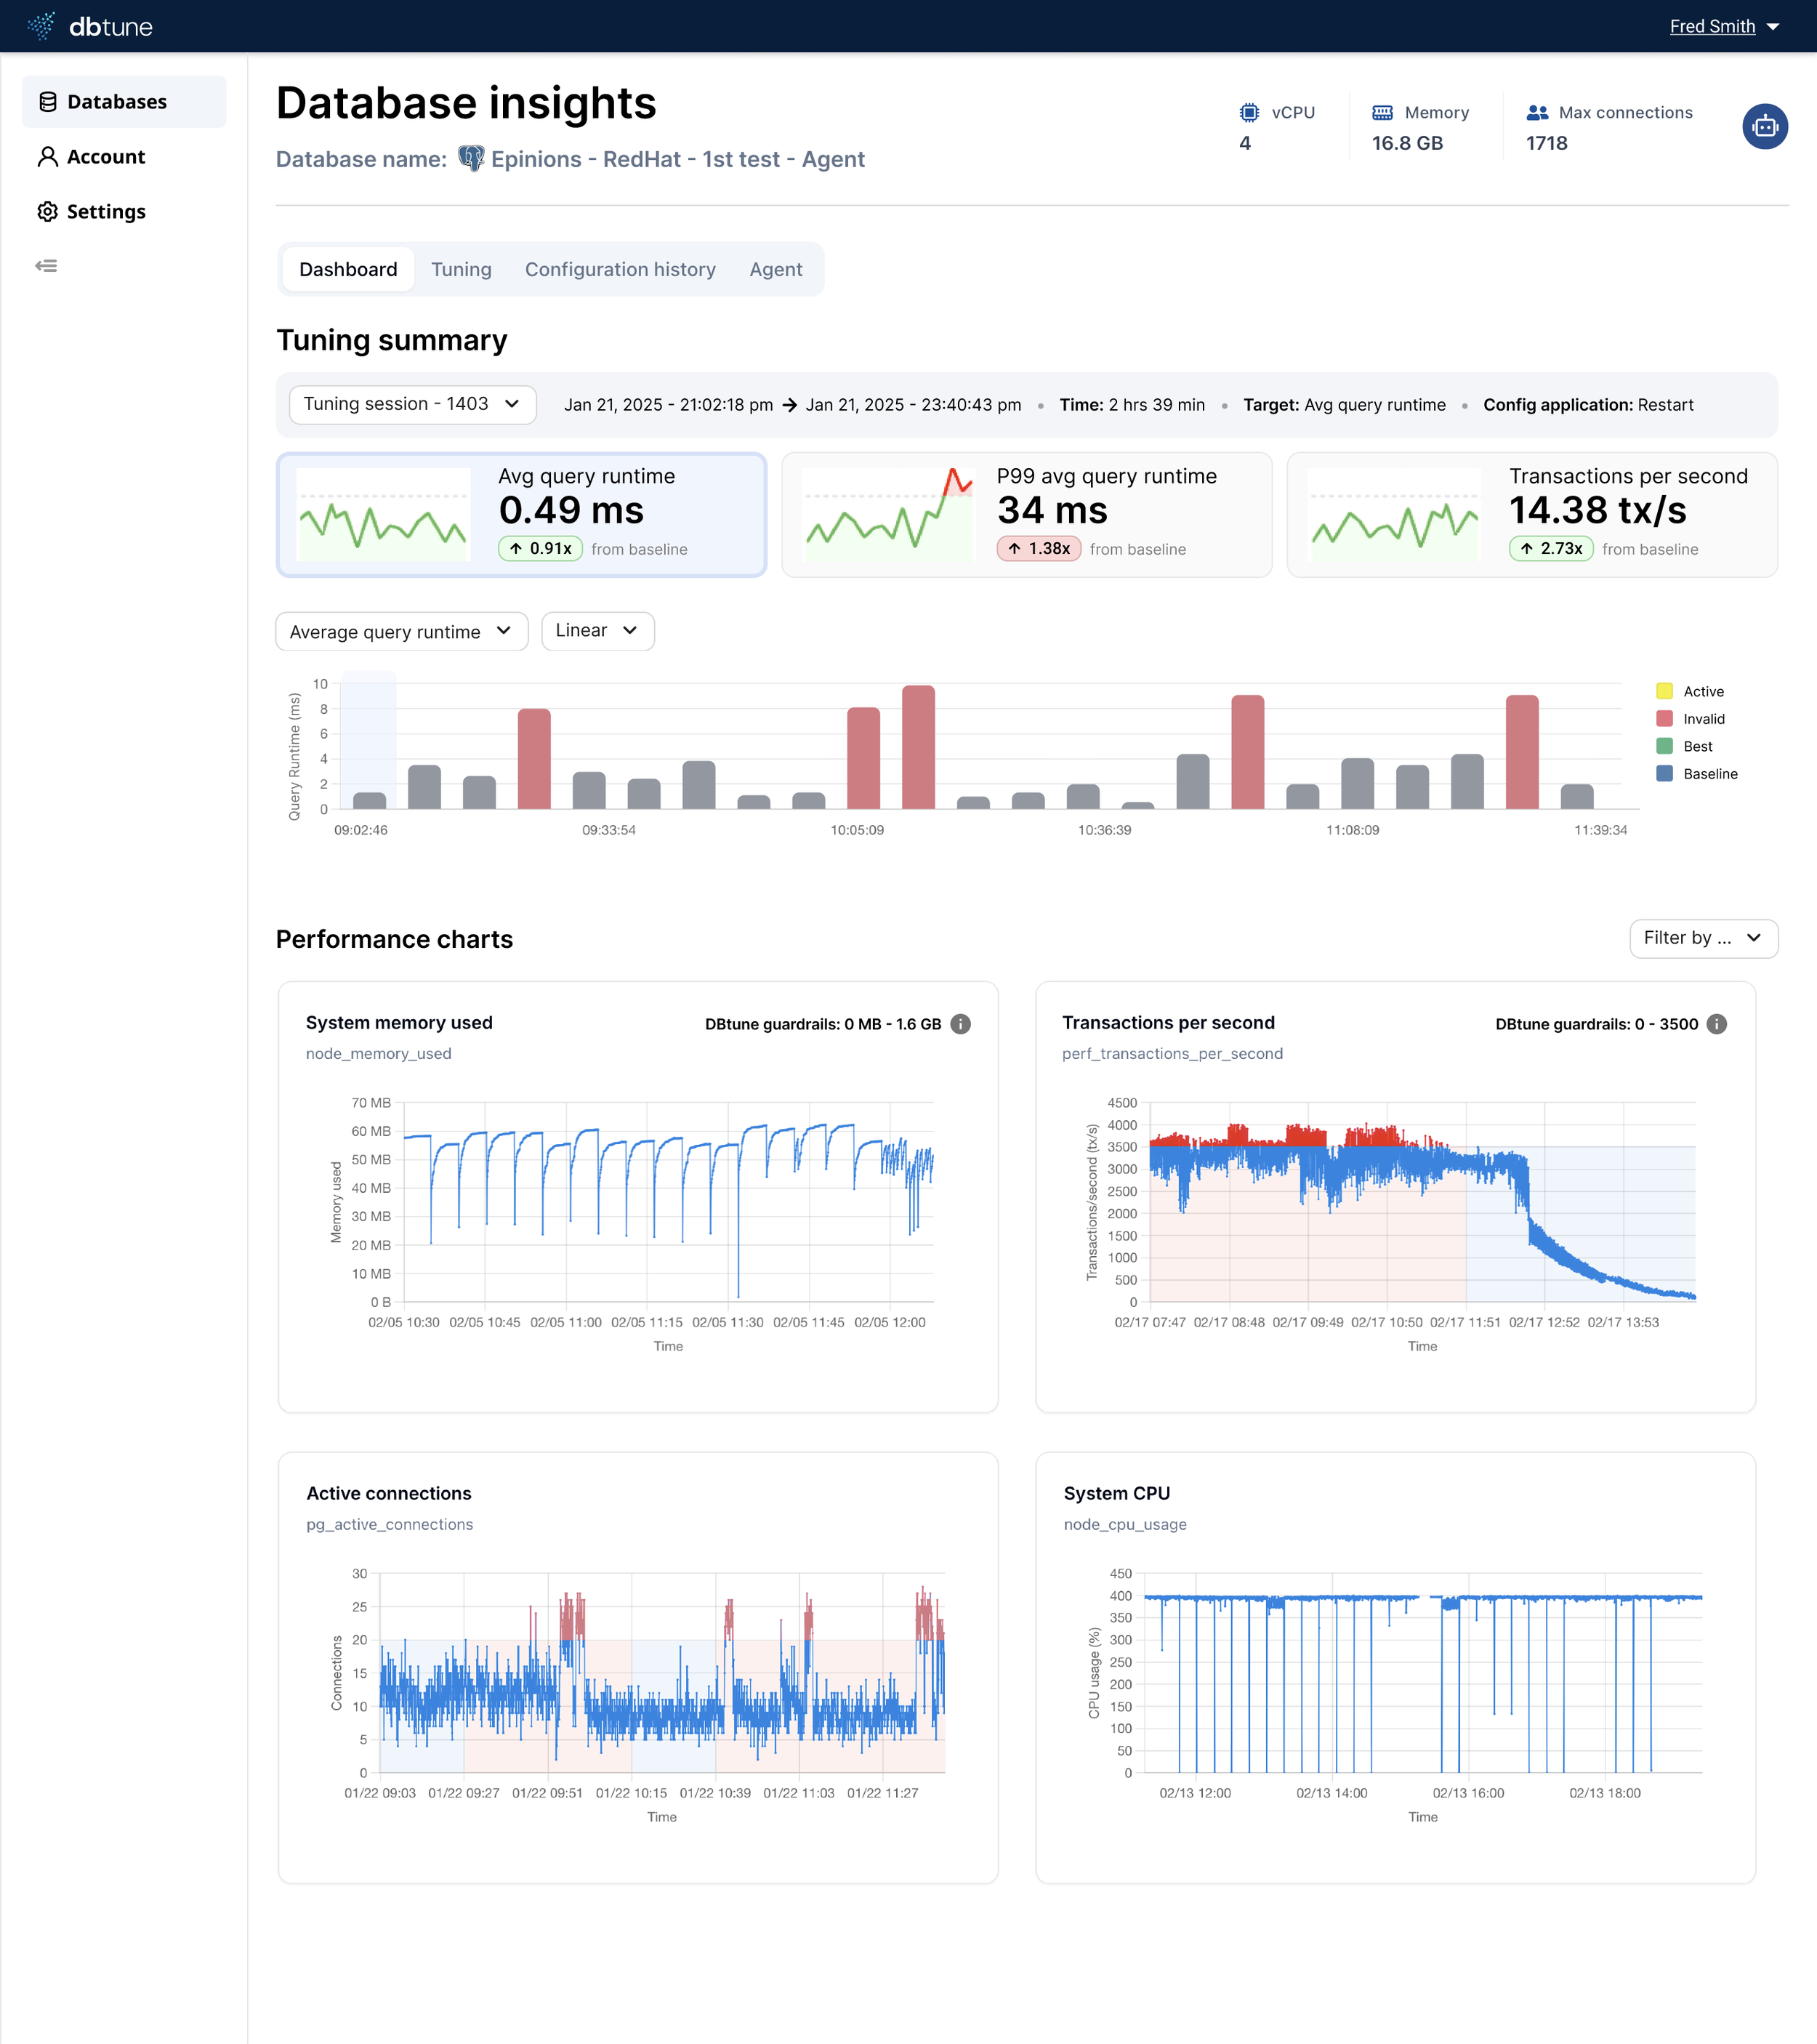
Proposed Dashboard
Original Dashboard
The original design created by engineering lacked in action items and health indication for a database that are available further down in the product, such as the individual database information page. Having just the name, host, cloud provider (typically empty) and agent status does not provide a large enough picture of a database’s status.
Missing data points that could easily be added here, and that are available elsewhere in the product and could inform the user of potential issues more immediately are:
Current configuration
Tuning status (active, inactive, etc)
Database version
Timestamps for disconnect, tuning status and more
Alert overview: critical, medium and healthy
Adding this to the dashboard, as seen in the proposed design below, the dashboard has a healthier balance between text and the use of visuals to immediately convey information to the user (e.g. alerts, database version, tuning status).
Eventually, graphs and charts will show database health based on a combination of various data metrics that will immediately convey to the user the state of their database (e.g. query latency, downtime, alerts, etc).
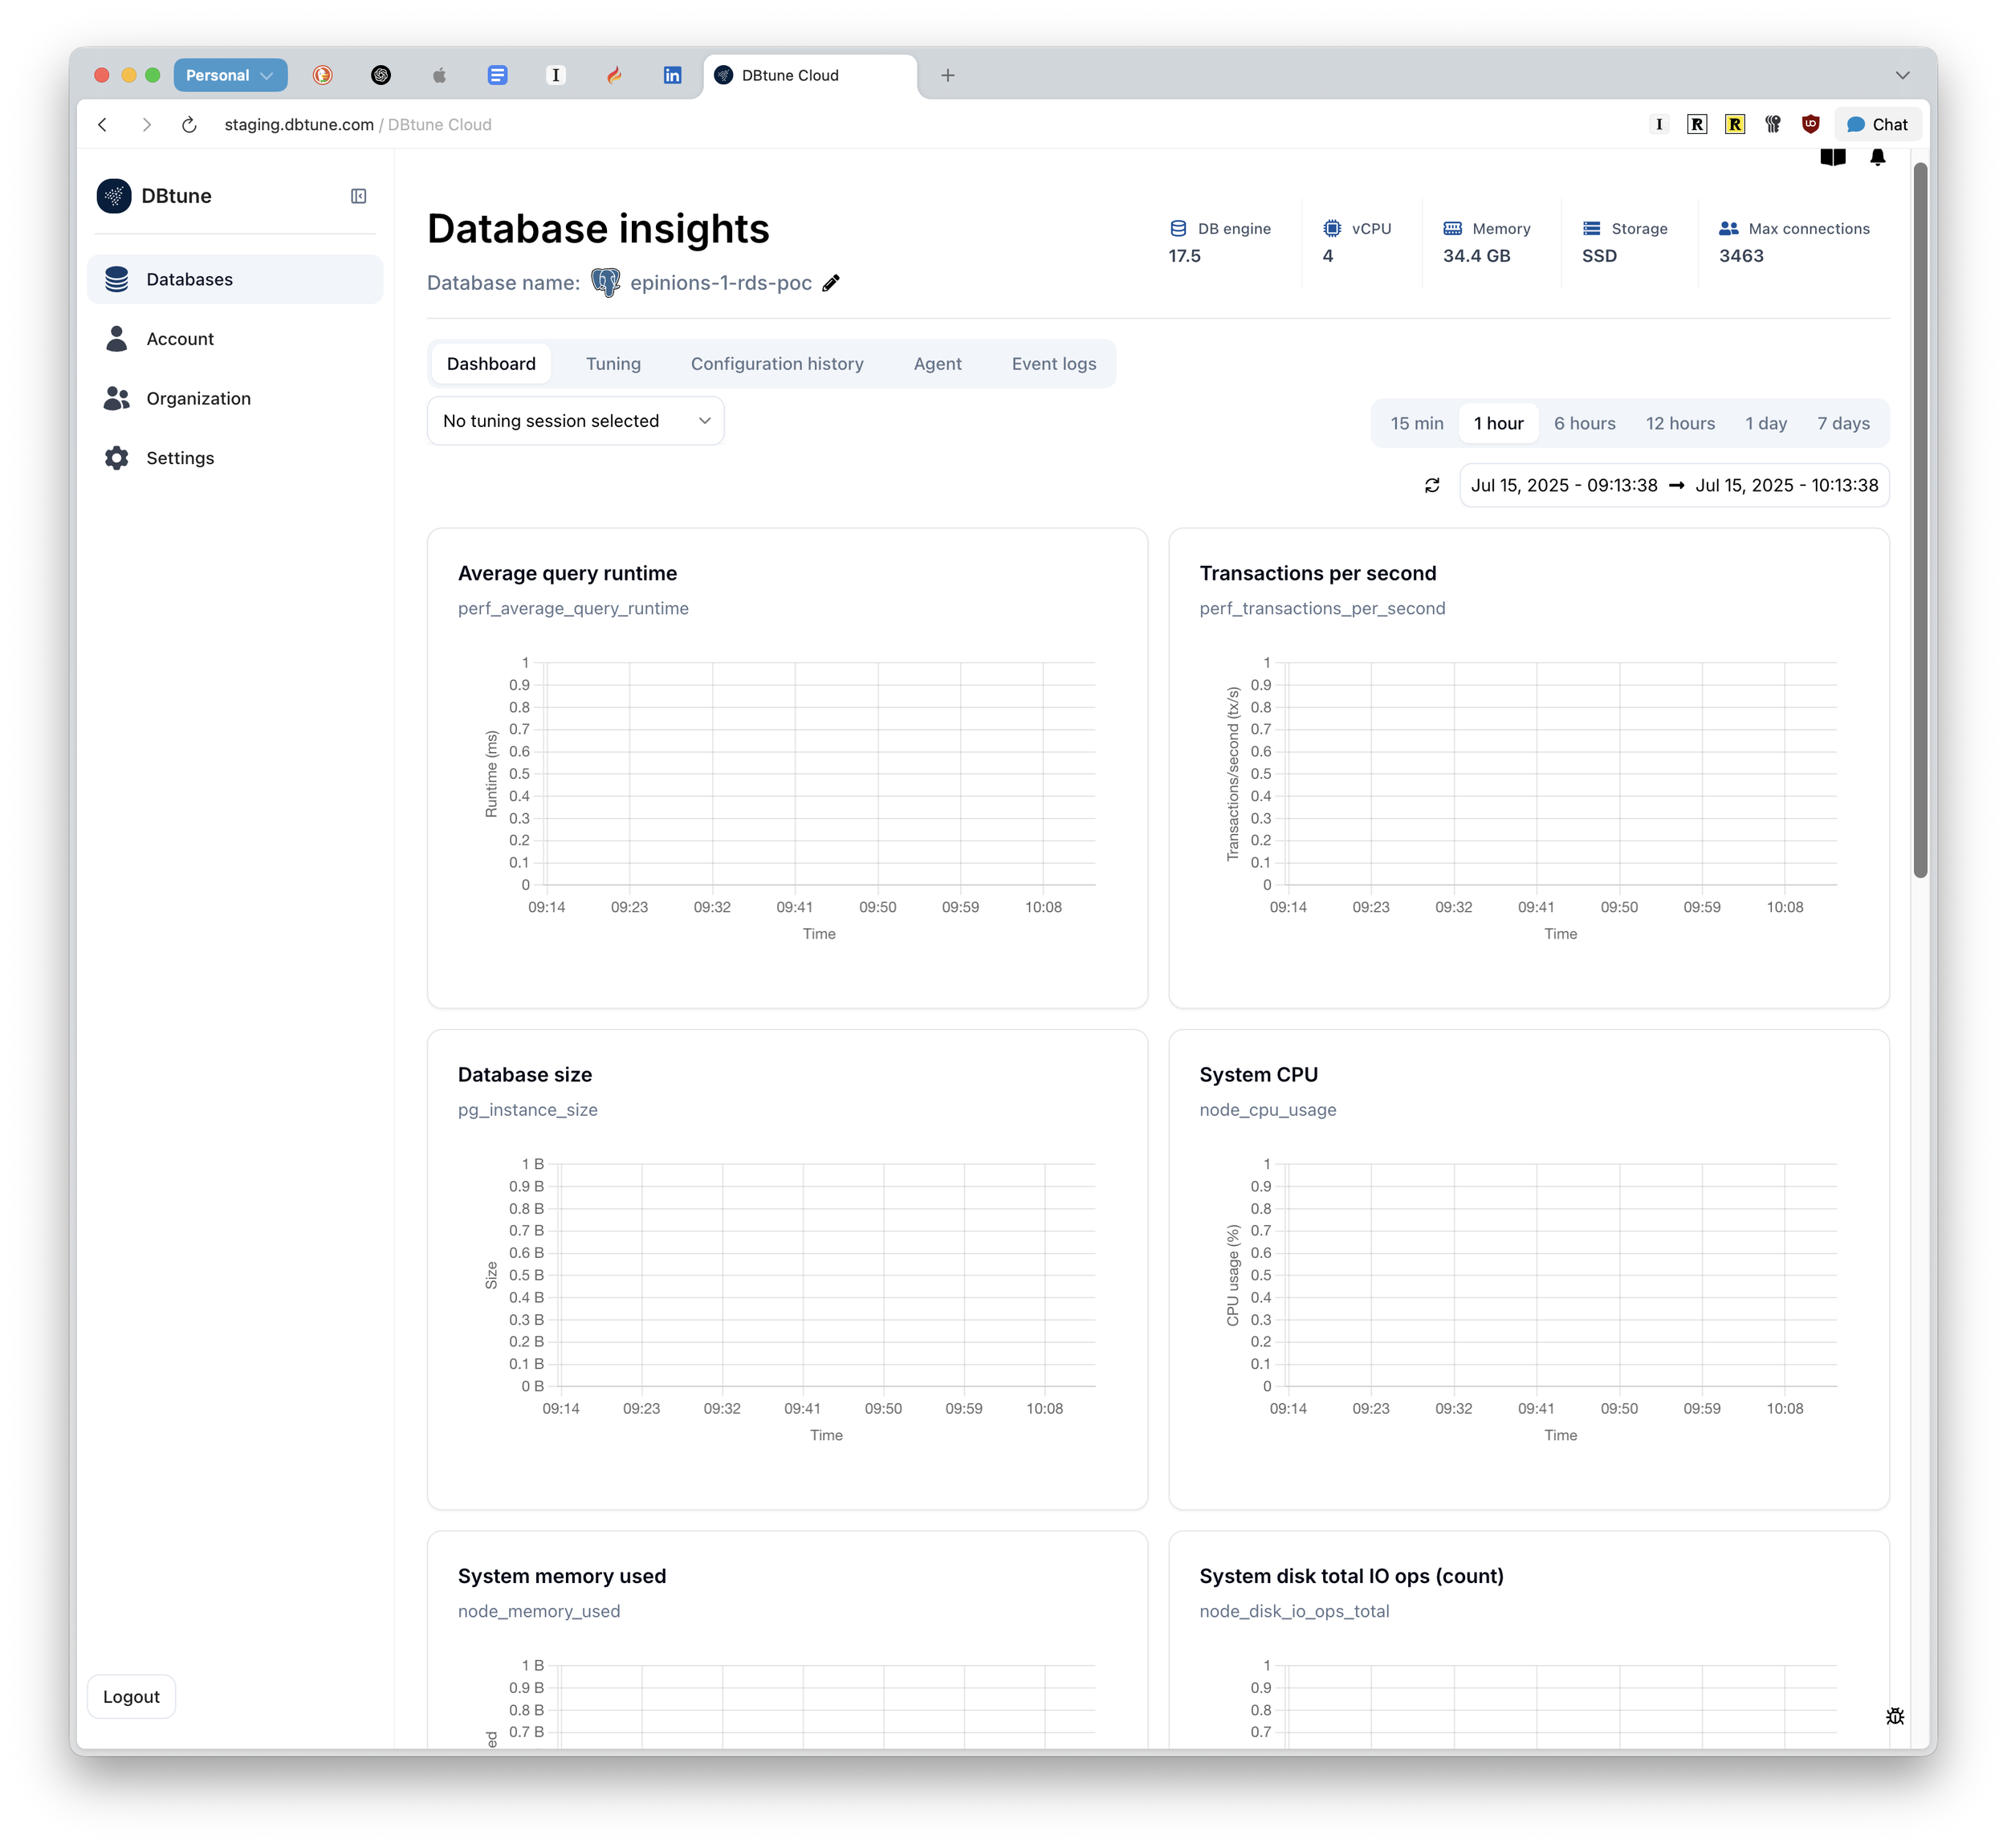
Current Configuration Comparison Flow
Dashboard Database Listing
Click a database name
Database Listing Dashboard or Agent
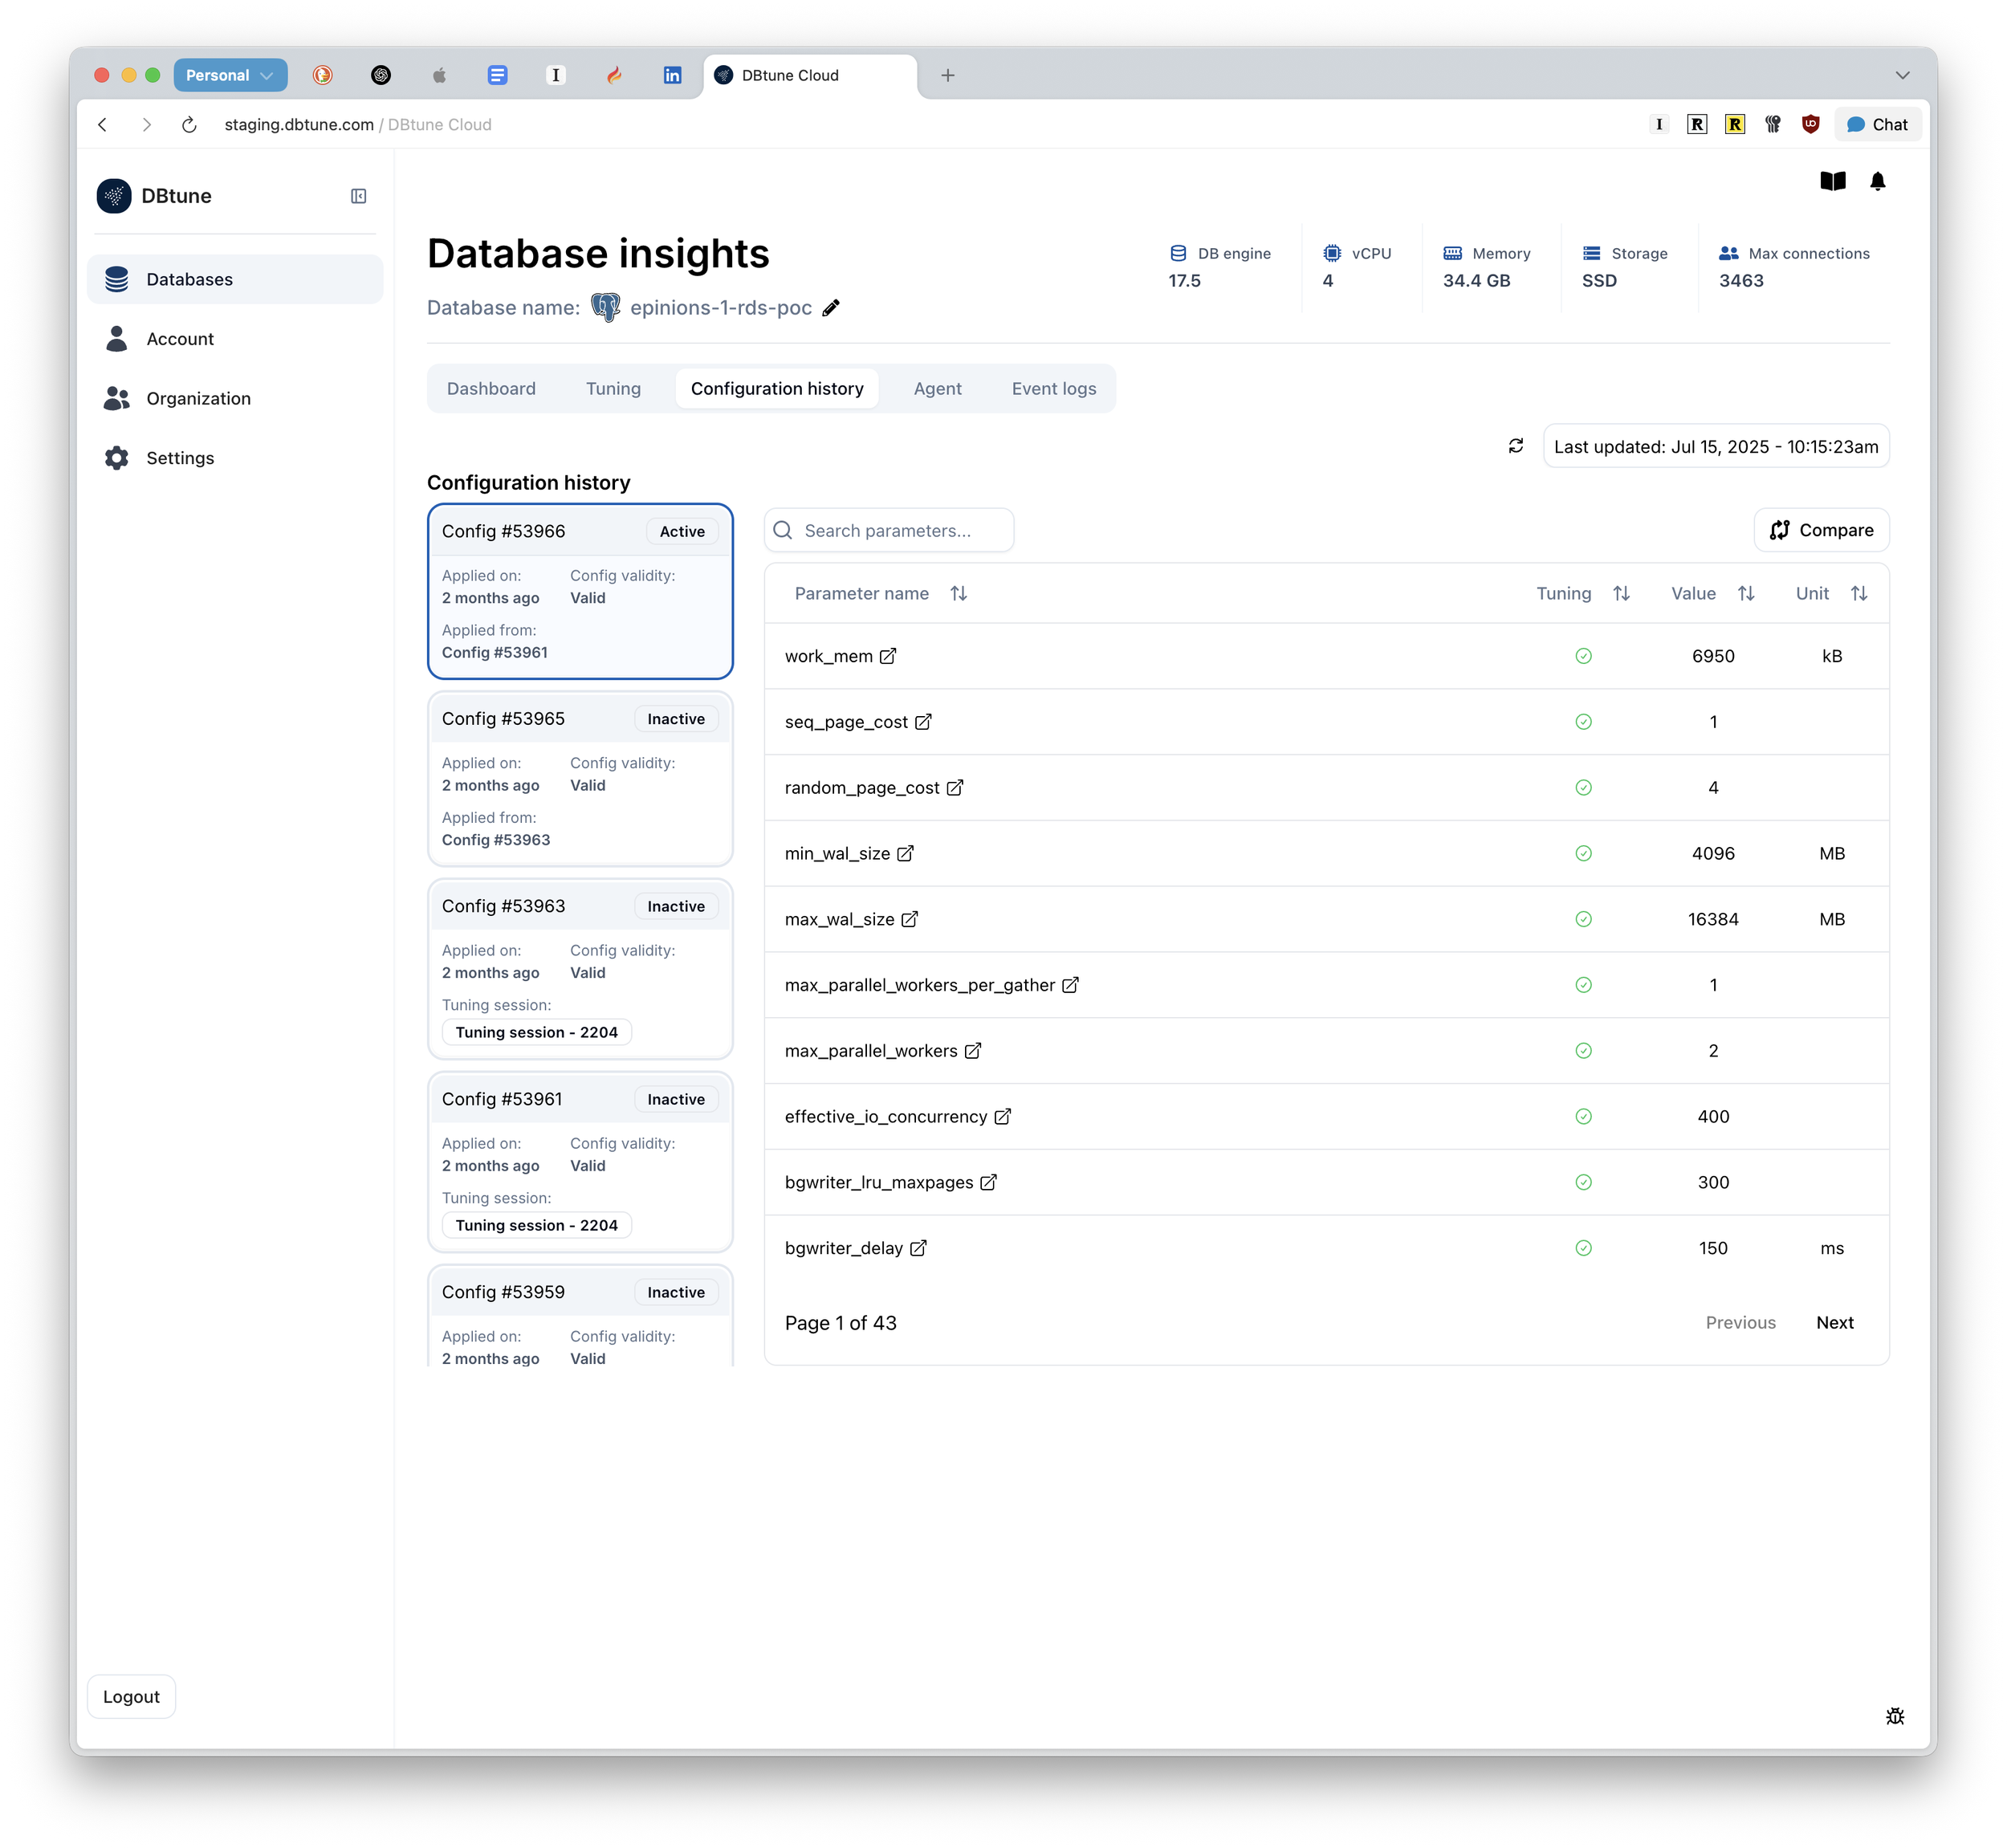
Click ‘Configuration history’ in top nav bar
Dashboard Database Listing
Select a config and then click ‘Compare’ to select additional configuration
Original Configuration Comparison
In the current product, comparing configurations within a tuning session requires navigating through multiple steps:
Starting from the dashboard listing and clicking the database name
Landing on either the dashboard or agent page, and then selecting ‘Configuration history’ from the top nav.
It’s a cumbersome process.
It can take up to 7 clicks until a user is able to view a comparison between two tuning session configurations. This can be brought down to 4 or 5 at the most and more intuitive.
Proposed Design Change
-
![]()
User Dashboard
It all begins with an idea. Maybe you want to launch a business. Maybe you want to turn a hobby into something more.
-
![]()
Tuning Session Dashboard
It all begins with an idea. Maybe you want to launch a business. Maybe you want to turn a hobby into something more.
-
![]()
Data Configurations
It all begins with an idea. Maybe you want to launch a business. Maybe you want to turn a hobby into something more.
-
![]()
Single Configuration View
It all begins with an idea. Maybe you want to launch a business. Maybe you want to turn a hobby into something more.
-
![]()
Configuraiton Comparison
Lorem ipsum foobar blah blah. Lorem ipsum foobar blah blah. Lorem ipsum foobar blah blah.


Current Design
-
![]()
User Dashboard
It all begins with an idea. Maybe you want to launch a business. Maybe you want to turn a hobby into something more.
-
![]()
Tuning Session Dashboard
It all begins with an idea. Maybe you want to launch a business. Maybe you want to turn a hobby into something more.
-
![]()
Data Configurations
It all begins with an idea. Maybe you want to launch a business. Maybe you want to turn a hobby into something more.
-
![]()
Single Configuration View
Lorem ipsum foobar blah blah. Lorem ipsum foobar blah blah. Lorem ipsum foobar blah blah.
-
![]()
Configuration Comparison
Description goes here


Portfolio | Bluesky | OtterTune | Triple Point | Topix